|
|
||||||||||||||
| According to the Department of Labor, by the end of 2011 there were a total of 7,449,507 unemployed Americans receiving some form of unemployment benefits. (3,685,651 for Regular State benefits + 3,048,926 for Federal extended benefits + others.) | |||||||||||||||
|
|
|||||||||||||||
|
|||||||||||||||
Median and Dual Income Households in 2011
All data on this page was compiled and linked to
government sources.
(To date, all data for FY2012 has yet to released.)
|
EXAMPLE: According to the Social Security Administration, for FY2011 half of all U.S. wage earners (who filed a W-4 with an employer and paid FICA taxes) earned $26,965.43 a year or LESS after taxes --- $26,965.43 was the "median" annual net income for all U.S. wage earners for 2011 --- meaning half earned more and half earned less. (Updated on SSA website for 2012)
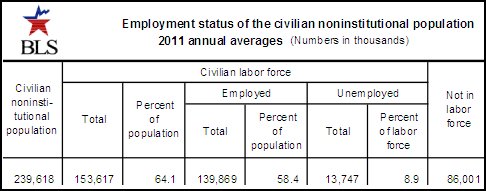
U.S. Household Incomes Before Taxes
(2011)
Individual Tax Returns (Primary Data) for 2011 - Source:
IRS
Wages Statistics for 2011 - Source:
SSA
| U.S. Census FY 2011 |
Number of Households | Median Household Income | Average Median Income Per Household | 2013 Update |
% of All Households |
| All Households | 121,084,000 | $50,054 | $50,054 | $51,404 | 100% |
| No Earners | 28,569,000 | $19,315 | $19,315 | * See notes | 23.60 |
| One Earner | 45,578,000 | $42,173 | $42,173 | - | 37.64 |
| Two Earners | 37,943,000 | $81,263 | $40,631 | - | 31.33 |
| Three Earners | 6,905,000 | $98,869 | $32,956 | - | 5.70 |
| Four (or more) | 2,089,000 | $121,918 | $30,479 | - | 1.73 |
| 2011 Labor Force | 151,380,749 | n/a | n/a | n/a | n/a |
| 2011 Tax Returns | 145,579,530 | n/a | n/a | n/a | n/a |
| Less Tax Returns > | 5,801,219 | n/a | n/a | n/a | n/a |
| 2011 Population | 311,591,917 | n/a | n/a | n/a | n/a |
|
|
||||||||||||||
| According to the Department of Labor, by the end of 2011 there were a total of 7,449,507 unemployed Americans receiving some form of unemployment benefits. (3,685,651 for Regular State benefits + 3,048,926 for Federal extended benefits + others.) | |||||||||||||||
|
|
|||||||||||||||
|
|||||||||||||||
|
||||||||||||
|
Other Miscellaneous Info for 2011 Bureau of Labor Statistics: "Urban households estimated that the market value of their owned home was $153,147, while rural households estimated that the market value of their owned home was $129,111, a difference of $24,036. Urban renters reported paying $699, on average, for monthly rent, while rural renters reported paying $354, on average."
Bureau of Labor Statistics: "In 2011, 73.9 million American workers age 16
and over were paid hourly rates, representing 59.1 percent of all wage and
salary workers. Of that number, 1.7 million earned exactly the prevailing
Federal minimum wage of $7.25 per hour and 2.2 million had wages below the
minimum. Together, these workers made up 5.2 percent of all hourly paid workers.
Part-time workers (persons who usually work fewer than 35 hours per week) were
more likely than full-time workers to be paid the Federal minimum wage or less
[and were mostly younger and less educated]." |
||||||||||||
Notes to Self
*** NOTE: Almost a quarter of all U.S. households live on a median income of $19,315 a year.
Wall Street Journal: CEO Options - The long-term capital gains tax rate
is 20% (+3.8% sur-tax for ObamaCare®) --- and the "qualified five-year"
capital gains tax rate is only 18%.
FORBES: "Capital gains are the key ingredient of income disparity in the
U.S. --- and more than 80% of the increase in income inequality over the past
several years was the result of an increase in the share of household income
from capital gains."
Quote from the late Justice Louis Brandeis: "We can have democracy in this country, or we can have great wealth concentrated in the hands of a few, but we can’t have both.”
Annual Social and Economic (ASEC) Supplement
Where did 15 million jobless Americans go?
* Wage, unemployment, and household data for 2011
* Data on Social Security disability (SSDI) from 1980 to 2012